Increasing economic activities, populations and the increasing impacts in terms of carbon emissions have started putting a negative impact on environment and ecology. In order to make a sustainable and healthy living conditions for us and our next generations, we at micro level level to have to take some measures for greening our surroundings.
At a micro level, we ourselves can take steps like planting trees, aware ourselves and our people around, change in our consumption pattern, innovate new technologies in order to develop a parallel resources pool and enhance our productivity and resources efficiency.
Carbon emission Reduction has been a challenge for the sustainable development of the world as a whole. According to the Kyoto protocol- UNFCCC (United Nations Framework Convention on Climate Change) there is a binding target for 37 industrialised countries and European community for reducing the GHG (Green House Gas) emission an average of 5% over the 5 year period 2008-2012, taking base as 1995. The developing economies have been given flexibility in their carbon emission reductions.To offset the carbon and control pollution different trading schemes have been taken into considerations. Carbon Emission trading is a market based approach by providing economic incentives and cap limit for emissions. Firms need to hold the no. of permits also called carbon credits (1 carbon credit = 1 ton Co2)
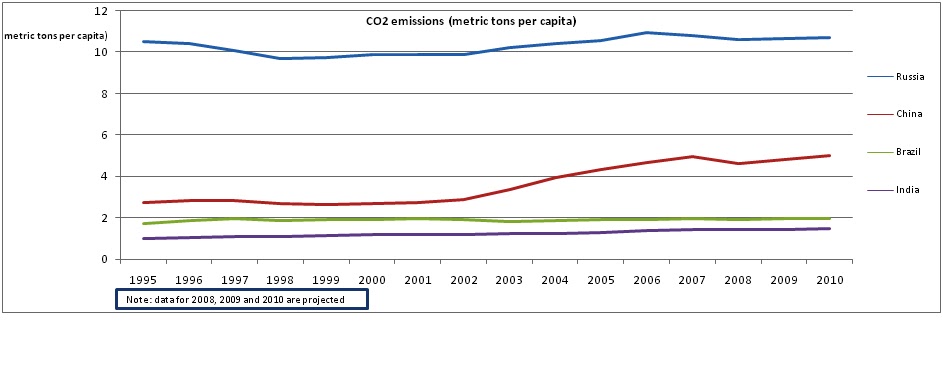
- Russia, Brazil, China and India have accounted for carbon emissions around 11, 5, 2 and 1.5 metric tons per capita in 2010.
- There has been almost same and increasing trend in carbon emission followed by all countries over the period.
- In 2001-02, Russia has a reduction in carbon emission i.e. 9.87 to 9.82 metric tons per capita but further shows an increasing trend. Russia has increased 10.31 MtCo2 per capita on an average over the period.
- China also shows upswing in carbon emissions specifically in 2004-07 periods that indicates an industrial uprising in the economy. However it decreased its per capita emission in 2007-08 i.e. from 4.95 to 4.6 approx. Over the period, it has increased around 3.60 MtCo2 per capita on an average.
- Brazil and India show a parallel and constant increase in emission. Brazil however also shows steadily decrease in per capita emissions on an average in comparison to India as per the graph. Over the period, Brazil and India have increased 1.87 and 1.22 MTCo2 per capita carbon emissions.
Challenges always keep coming. Proper actions are needed. In addition to bring awareness; we will have to pursue with each and every aspects of environmental degradations at a grass roots level.
Comments
Yes u are right. its time for action.
good initiative
very much informative...thanks
Thanks for useful information...
very useful information sir,Thank U Sir........mano
Jhajee,
Excellent information. Thanks a lot.
Regards.
SKP